Command needed for measuring overall CPU usage in percentage

Hi all, :wave:

do you know of an effective way of measuring CPU usage of a system in percent with command-line tools :question:
Not on a process-by-process basis. Just the overall CPU usage.

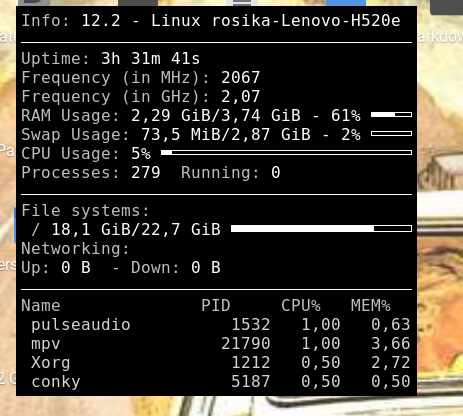
On my Linux Lite system I keep conky running at all times and it shows me CPU usage in percent.
That´s alright but I need something like that for the command-line.

The background to my question is:

I mostly establish connection to my virtual machines by ssh-ing into them from my host.
Most of the times the terminal is enough for me. I don´t need the GUI representation of the tools every time. :wink:

What I´d like to do is compare different OSes after logging into the VMs the way I described.
Just starting the OS, logging in and not running anything except a command that would provide information about overall CPU usage.

My suspicion is that e.g. Arch Linux stresses the CPU to a (slightly) lesser extent than FreeBSD.
I´d like to corroborate my suspicion that way.

Many thanks in advance and many greetings from Rosika :slightly_smiling_face:

5 Likes

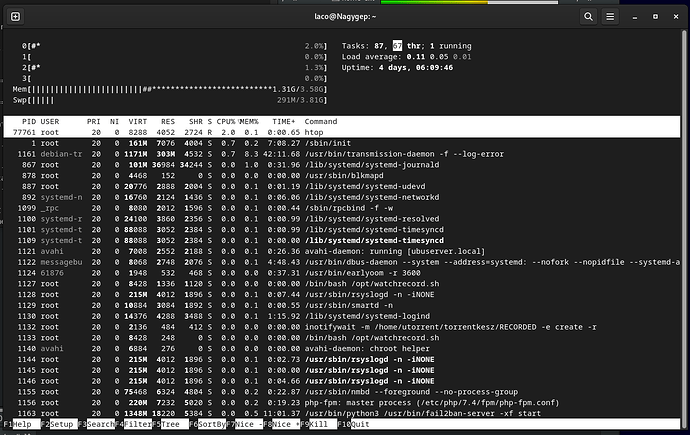
Maybe you think of something like htop ?

Or just top ?

5 Likes

Hi LĂĄszlĂł, :wave:

thanks for your suggestions.

I was already taking top and htop into consideration but in the end I couldn´t seem to get the overall percentage use of the system.
Perhaps it´s my fault… :neutral_face: .

E.g. conky does seem to provide what I need in a simple way:

kgw_conky2

But it uses a GUI. I need the command-line.

In this example I can see: CPU Usage: 5% (all in all).
That´s what I need for a simple comparison of OSes.

In the examples using top and htop you provided:
Can I get such an overall value as well?

If so, could you help me with the interpretation? I seem to be stuck.

I´d like to employ top or htop…

Many thanks, LĂĄszlĂł. :heart:

Cheers from Rosika :slightly_smiling_face:

1 Like

I don’t really know what conky reports there?
Does it change every second?
Or is it accumulated over some timeframe?
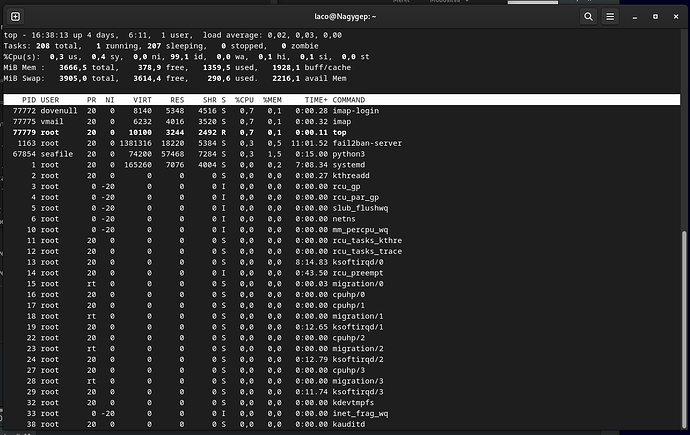
If it’s changing quickly, it’s a “current CPU usage”, so that’s what top reports too.
(On my picture 99.1% id is what you want: that’s the idle percent, you actually want 100-idle)
You may look for iostat -t 1 for example, that will report a %idle too, again, 100-idle is what you want too see maybe.

If you want a longer average, top reports it in the upper-right corner, tha same values you’ll get from uptime command as load average.

Read this maybe: Understanding Linux Load Average: A Beginner's Guide with Real-World Analogies - Linodelinux

2 Likes

Hi LĂĄszlĂł, :wave:

thanks a lot for your reply and help.

Yes, you´ree right. I should´ve mentioned it.
The value changes every second. It represents the current state.

iostat seems to be good suggestion.
I ran the command iostat 1 5 and got these results:

iostat 1 5
Linux 5.15.0-119-generic (rosika-Lenovo-H520e) 	10.09.2024 	_x86_64_	(4 CPU)

avg-cpu:  %user   %nice %system %iowait  %steal   %idle
           8,50    0,01    3,13    2,00    0,00   86,36

[...]

avg-cpu:  %user   %nice %system %iowait  %steal   %idle
           3,30    0,00    1,78    1,02    0,00   93,91

[...]


avg-cpu:  %user   %nice %system %iowait  %steal   %idle
           2,48    0,00    2,73    0,00    0,00   94,79

[...]


avg-cpu:  %user   %nice %system %iowait  %steal   %idle
           1,53    0,00    1,27    0,25    0,00   96,95

[...]

avg-cpu:  %user   %nice %system %iowait  %steal   %idle
           2,28    0,00    0,76    0,00    0,00   96,95

[...]

I think I can ignore the first output 86.36% because it surely shows the effects of starting the iostat command itself.

The next 4 come pretty close to one another:

93.91%, 94.79%, 96.95% , 96.95%

Those values should be more meaningful.
I think I´ll give iostat a shot. Thanks a lot, Låszló. :heart:

I was also trying to employ the command:

top -bn1 | grep "Cpu(s)" | awk '{print $2 + $4}'

  • top -bn1 runs top in batch mode, for 1 iteration.
  • grep “Cpu(s)” looks for the line containing CPU usage
  • awk '{print $2 + $4}'extracts and adds the user CPU and system CPU percentage

But that doesn´t provide some output I can deal with. It´s a snapshot of the current sutuation.

rosika@rosika-Lenovo-H520e ~> top -bn1 | grep "Cpu(s)" | awk '{print $2 + $4}'
13
rosika@rosika-Lenovo-H520e ~> top -bn1 | grep "Cpu(s)" | awk '{print $2 + $4}'
11
rosika@rosika-Lenovo-H520e ~> top -bn1 | grep "Cpu(s)" | awk '{print $2 + $4}'
14
rosika@rosika-Lenovo-H520e ~> top -bn1 | grep "Cpu(s)" | awk '{print $2 + $4}'
13
rosika@rosika-Lenovo-H520e ~> top -bn1 | grep "Cpu(s)" | awk '{print $2 + $4}'
10
rosika@rosika-Lenovo-H520e ~> top -bn1 | grep "Cpu(s)" | awk '{print $2 + $4}'
7
rosika@rosika-Lenovo-H520e ~> top -bn1 | grep "Cpu(s)" | awk '{print $2 + $4}'
7
rosika@rosika-Lenovo-H520e ~> top -bn1 | grep "Cpu(s)" | awk '{print $2 + $4}'
13

Too much of a variation.

I like your suggestion of using iostat better.
Thanks so much, LĂĄszlĂł.

Man greetings from Rosika :slightly_smiling_face:

2 Likes

Ya I use the same!
For me htop works just fine!

3 Likes

There is also mpstat
It is in the sysstat package in Debian, not sure about Arch.

3 Likes

You can use sar command. While it does record historical data for system resources usage, you’ll need another tool to plot some sort of graphs.

Perhaps I’ll create a tutorial on this subject.

3 Likes

Would htop be better than just top (which I use mainly for memory use)

https://www.howtogeek.com/how-to-use-linux-htop-command

1 Like

For memory I use
free -m

I like htop because it shows me a per core gauge on CPU usage.

I would have been surprised if there were no other tools for this purpose :smiley:

I never looked at this, but this one seems to be even better than my iostat approach.
mpstat 1
displays CPU usage every second without the “mess” iostat adds…
I mean, @Rosika wants only CPU usage info, mpstat gives that.
I used to use iostat -x -t 1 to look at the load of the disks, I just remembered there’s a CPU usage stat too, which I didn’t ever need :slight_smile:

3 Likes

Whatever utility you use, remember to check how it deals with multiprocessor cpu’s
Lets say you have 4 cores, and some process uses all 4 cores to full capacity

  • some utilities will report that as 400%
  • some utilities will report that as 100%
  • some really fancy utilities will report all 4 cores separately
4 Likes

Hi to all of you again, :wave:

thanks a lot for all of your suggestions. :heart:

@nevj :

Thanks for mentioning it.
In fact I stumbled upon yesterday as well :wink: :
mpstat Command in Linux with Examples - GeeksforGeeks .

Just tried it out:

Linux 5.15.0-119-generic (rosika-Lenovo-H520e) 	11.09.2024 	_x86_64_	(4 CPU)

13:47:01     CPU    %usr   %nice    %sys %iowait    %irq   %soft  %steal  %guest  %gnice   %idle
13:47:01     all    6,69    0,02    2,42    6,03    0,00    0,06    0,00    0,00    0,00   84,78

…

Thanks for pointing that out, Neville.

@abhishek :

Thanks a lot, Abhishek.

The sar command was indeed new to me, I have to admit.

I got this message though:

sar -u
Cannot open /var/log/sysstat/sa11: No such file or directory
Please check if data collecting is enabled

According to fosslinux :

Sometimes when attempting to use ‘sar -u’ to view CPU usage, users may encounter an error stating that data collection is not enabled.

This error message indicates that the system activity data required for ‘sar’ is not being collected or stored. To fix this issue, we need to enable data collecting and configure the sysstat package correctly.

To enable data collecting, open the /etc/default/sysstat configuration file using your preferred text editor:

Find the following line in the configuration file:
ENABLED="false"

Change the value from “false” to “true”:
ENABLED="true"

Save the changes and exit the text editor.

Also:

To configure the data collection interval, edit the /etc/cron.d/sysstat file:

By default, the sysstat package collects data every 10 minutes. To change the interval, find the following line:

5-55/10 * * * * root command -v debian-sa1 > /dev/null && debian-sa1 1 1

Replace ‘/10’ with your desired interval (e.g., ‘/5’ for a 5-minute interval):

5-55/5 * * * * root command -v debian-sa1 > /dev/null && debian-sa1 1 1

Save the changes and exit the text editor.

To apply the changes, restart the sysstat service:

sudo systemctl restart sysstat

I´ll still have to do that.

@kovacslt :

Yes, that´s exactly what I need. Thanks, Låszló.

Also thanks @TypeHrishi and @callpaul.eu for your posts.

@all:

Well, what I´d like to achieve is getting the CPU value detached from any momentary snapshot. Like smoothing out the variability.

Doing a bit of further research on the matter I came up with this command yesterday (ChatGPT helped a lot with it, I have to admit :wink: ):

top -bn10 | grep "Cpu(s)" | awk '{u+=$2; s+=$4} END {print "Average CPU usage:", u/NR + s/NR, "%"}'

Explanation:

  • The top command provides real-time system stats like CPU usage, memory usage, etc.
    -b: This flag tells top to run in batch mode, which outputs the data to the terminal instead of running interactively.
    -n10: This means the command will run 10 iterations of top. Instead of running indefinitely like it does in interactive mode, it captures data 10 times and then stops.

  • grep “Cpu(s)”: This filters the output of top and selects only the lines containing the string "Cpu(s)

  • awk:
    u+=$2; s+=$4:
    $2: Refers to the second field in the output (user CPU percentage).
    $4: Refers to the fourth field in the output (system CPU percentage).
    u+=$2: This adds the value of the second field ($2, user CPU usage) to the variable u. This means u accumulates the user CPU usage across all 10 iterations.
    s+=$4: Similarly, this adds the value of the fourth field ($4, system CPU usage) to the variable s. This means s accumulates the system CPU usage.
    At the end of this loop, u will hold the total user CPU usage from all 10 snapshots, and s will hold the total system CPU usage.

  • END {}: This block is executed after awk has processed all the input lines.
    NR: A special variable in awk that represents the number of records (or lines) processed. In this case, it will be 10, since top was run 10 times.
    u/NR: This calculates the average user CPU usage by dividing the total accumulated value u by the number of records (NR = 10).
    s/NR: Similarly, this calculates the average system CPU usage.
    u/NR + s/NR: This adds the average user and system CPU usage together to get the overall CPU usage.
    print “Average CPU usage:”, …: This prints the final result in a readable format.

Note:

By default, top updates its statistics roughly once every 3 seconds when running in batch mode. This means that each iteration of top takes about 3 seconds to complete.

So the command took roughly 30 seconds to finish.

I ran it 3 times in a row:

rosika@rosika-Lenovo-H520e ~> top -bn10 | grep "Cpu(s)" | awk '{u+=$2; s+=$4} END {print "Average CPU usage:", u/NR + s/NR, "%"}'
Average CPU usage: 2.8 %
rosika@rosika-Lenovo-H520e ~> top -bn10 | grep "Cpu(s)" | awk '{u+=$2; s+=$4} END {print "Average CPU usage:", u/NR + s/NR, "%"}'
Average CPU usage: 3.2 %
rosika@rosika-Lenovo-H520e ~> top -bn10 | grep "Cpu(s)" | awk '{u+=$2; s+=$4} END {print "Average CPU usage:", u/NR + s/NR, "%"}'
Average CPU usage: 2.9 %

rosika@rosika-Lenovo-H520e ~> bc -l
bc 1.07.1
Copyright 1991-1994, 1997, 1998, 2000, 2004, 2006, 2008, 2012-2017 Free Software Foundation, Inc.
This is free software with ABSOLUTELY NO WARRANTY.
For details type `warranty'. 
(2.8+3.2+2.9)/3
2.96666666666666666666
quit

… and then calculated the average.

I guess this should provide a pretty accurate notion of CPU usage in a more or less idle state.
Of course, I didn´t start any other processes in the meantime, just let the command run three times.

Thanks so much to all of you for your help. :heart:

Many greetings from Rosika :slightly_smiling_face:

3 Likes

Thanks for the feedback that gives us several more toys to play with

3 Likes

Hi Paul, :wave:

you´re welcome.

Here´s an additional note:

If you want the command to complete faster, you can modify the sampling interval of top.

As I mentioned, by default, top uses a 3-second delay between each iteration, but you can reduce this delay to make the command run faster.
For example, adding the -d flag allows you to specify the delay between updates:

top -d 1 -bn10 | grep "Cpu(s)" | awk '{u+=$2; s+=$4} END {print "Average CPU usage:", u/NR + s/NR, "%"}'

Here the -d 1 option sets the delay between each iteration to 1 second.
Now, with 10 iterations, the command should take around 10 seconds to complete instead of 30. :wink:

I like the 3 sconds pause though. It might provide a more accurate picture in the end.

Cheers from Rosika :slightly_smiling_face:

4 Likes

My own requirements are very simple its just to know the total memory on a computer before i decide which verson of linux i install, saves me taking the cover off, before i also needed to know 32 or 64 bit but thankfully that issue has now almost disappeared as its getting around 20 years since they were constructed

2 Likes