Getting started with the Julia language

Hi Neville, :waving_hand:

I had to look up imageJ first. I´ve never heard of it before.

Counting and measuring objects in digital images with ImageJ

Ah, I see. Thanks. Seems interesting.
Still: your effort is remarakble and praise is due, by all means.

Cheers from Rosika :slightly_smiling_face:

2 Likes

Hi Rosika,
Yeah, I am not inventing anything new. For me it is a good task to use to help learn Julia.
Having a definite project helps with learning a language… remember that when you get to make a start with Python.
Regards
Neville

2 Likes

Hi Neville, :waving_hand:

You´re perfectly right. But I´ll have to achieve some basics first, I guess.
For Python indentation seems crucial to know and things like that.

I´m only taking my first steps with Python.
Haven´t come up with anything worth mentioning yet.

  • print("Hello, World!")
  • import sys
    print(sys.version)
  • help('modules')
  • exit()

That´s all so far. Pretty little which I have achieved so far.
Still baby steps. :blush:

Many greetings from Rosika :slightly_smiling_face:

P.S.:

I found this source as some hopefully good tutuorial:

2 Likes

Hi Rosika,
That is progress… keep going… learn by trying things form a document, then modify them to suit you.
Be patient… you have seen how long it is taking me with Julia.
Regards
Neville

2 Likes

Hi Neville, :waving_hand:

thanks for the heads-up, dear Neville. :heart:
Yes, I´ll do my very best not to get disheartened right at the beginning. :wink:

And you´re quite right: patience is of the essence.

Cheers from Rosika :slightly_smiling_face:

2 Likes

Hi Rosika,
I just do about 1-2 hours each day.
That way you eventually win
Trying to do a marathon effort does not work for me.
Regards
Neville

3 Likes

@nevj :

Thanks for the additional tip.

Yes, running marathons with projects like that wouldn´t be right for me either.
Doing things on a regular basis seems better.

Cheers from Rosika :slightly_smiling_face:

2 Likes

@nevj If you end up looking at something besides Julia, you could look at Python. Maybe you already have. I saw this posted on Facebook. It demonstrates how little code can sometimes be required to do pretty amazing things. The rembg PIP package is written mostly in Python, but other times it’s written in C or Rust so the speed would be there too. Same way with many statistical packages.

3 Likes

I will be . Maybe not for image processing, but I have decided to get up to date with languages, so I will be expanding my R and C into Julia, Rust, and Python.

The image processing was just an exercise… I have already done it in R. … yes R has some good imaging packages as well as stats… I think Julia has slightly more image processing facilities than R, but there is not much in it. R has better stats libraries. Python has imaging libraries too… maybe I should do the exercise a third time in Python.

My real aim in Julia is to get proficient enough to be able to convert some of my R software and take advantage of Julia’s parallel processing facilities. My next exercise will be running R functions in Julia. Have to finish this first.

3 Likes

I have written a Julia function called objmeanrgb() which finds objects in a labelled image and computes the mean RGB values of the corresponing pixels in the original RGB image.

trinity:[nevj]:~/juliawork$ cat imgfuncs.jl
#module ImgFuncs
# export objmeanrgb
 function objmeanrgb(labimg,measdf,rgbimg) 
# mean rgb values for objects separated in a label image
  df = DataFrame(Area=measdf.area,Red=0.0,Green=0.0,Blue=0.0,Count=0)
  n = nrow(measdf)
  rows = size(rgbimg,1)
  cols = size(rgbimg,2)
  count = zeros(Int,n)
  sumr = zeros(n)
  sumg = zeros(n)
  sumb = zeros(n)
  for i in 1:rows
    for j in 1:cols
      objno = labimg[i,j]
      if objno > 0
        count[objno] = count[objno] + 1
        sumr[objno] = sumr[objno] + Float32.(red.(rgbimg[i,j]))
        sumg[objno] = sumg[objno] + Float32.(green.(rgbimg[i,j]))
        sumb[objno] = sumb[objno] + Float32.(blue.(rgbimg[i,j]))
      end
    end
  end
  df.Red = sumr ./ count
  df.Green = sumg ./ count
  df.Blue = sumb ./ count
  df.Count = count
  return df 
 end

#end

It is on a separate file called imgfuncs.jl which may in future contain additional imaging functions. Notice that I experimented with making it a module, then commented the module bits out… I found modules caused all sorts of ‘not found’ problems, even if I exported the function name. The function counts and sums pixels in a loop. I included the ‘measdf’ dataframe as an argument, because I wanted the area mearurement from it. The function returns a DataFrame object.

The main Julia program calls this function as follows

using Pkg
Pkg.activate("imagenv")
include("imgfuncs.jl")
#using .ImgFuncs
using Images, FileIO, ImageView, ImageIO, Gtk4, Plots

guidict = imshow_gui((800, 600))
c = guidict["canvas"];

img = load("3506s.jpg")
#imshow(img,canvassize = (800,600))

# using ImageBinarization
s = recommend_size(img)
imgb = binarize(AdaptiveThreshold(percentage = 15, window_size = s), img)
#imshow(imgb,canvassize = (800,600))

imgbrev = Int.(imgb) .== 0
#imshow(imgbrev,canvassize = (800,600))

imgbreverode = erode(imgbrev,strel_box((5,5)))
# imgbrevdilate = dilate(imgbrev,strel_box((7,7))) 
# imgbreverode = erode(imgbrevdilate,strel_box((7,7)))

imglab = label_components(imgbreverode)
#imshow(imglab,canvassize = (800,600)) 
dc = distinguishable_colors(500)
heatmap(imglab,color=palette(dc,500),yflip=true)
# heatmap display is upside-down

using ImageComponentAnalysis
imgmeas = analyze_components(imglab,BasicMeasurement(area=true))
histogram(imgmeas.area)
using Statistics
mean(imgmeas.area)
median(imgmeas.area)

using DataFrames
bundledf  = objmeanrgb(imglab,imgmeas,img)

That last line is the function call
What we see when it runs is

julia> bundledf  = objmeanrgb(imglab,imgmeas,img)
396×5 DataFrame
 Row │ Area       Red       Green     Blue       Count 
     │ Float64    Float64   Float64   Float64    Int64 
─────┼─────────────────────────────────────────────────
   1 │   238.0    0.824125  0.208306  0.212013     237
   2 │    55.625  0.83451   0.23508   0.28164       55
   3 │ 10050.4    0.823582  0.22128   0.203582    9996
   4 │     4.125  0.788235  0.311765  0.365686       4
   5 │  2800.62   0.813379  0.204517  0.189252    2792
   6 │     8.125  0.848529  0.385294  0.423039       8
   7 │   566.125  0.829961  0.29072   0.29042      561
   8 │  7071.0    0.808323  0.215711  0.205289    7049
   9 │  1455.38   0.775666  0.121109  0.118668    1452
  10 │     1.0    0.780392  0.270588  0.309804       1
  11 │   582.625  0.839045  0.278138  0.250543     574
  12 │   910.5    0.836408  0.261074  0.258828     901
  13 │   795.625  0.836472  0.270384  0.261299     789
  14 │  8288.88   0.808994  0.179979  0.172811    8250
  15 │  1129.88   0.812038  0.184968  0.168393    1121
  ⋮  │     ⋮         ⋮         ⋮          ⋮        ⋮
 382 │  2660.5    0.811537  0.188043  0.173482    2653
 383 │     1.0    0.87451   0.317647  0.301961       1
 384 │     2.0    0.866667  0.333333  0.305882       2
 385 │  1172.62   0.827437  0.246778  0.220094    1161
 386 │   242.75   0.811023  0.224287  0.199967     238
 387 │     8.0    0.678922  0.1       0.0759804      8
 388 │   335.625  0.823541  0.241573  0.226859     331
 389 │  2117.0    0.803853  0.190015  0.169664    2107
 390 │    53.625  0.829967  0.278357  0.280133      53
 391 │     1.0    0.815686  0.266667  0.262745       1
 392 │   198.125  0.819548  0.246239  0.232813     196
 393 │  2252.0    0.794751  0.14981   0.163935    2239
 394 │    11.375  0.849554  0.266667  0.276649      11
 395 │    41.625  0.812243  0.184122  0.195791      41
 396 │     4.0    0.838235  0.302941  0.333333       4
                                       366 rows omitted

ie a table with 396 rows ( one for each object) and 5 columns of means and a count. The ‘Area’ column is transcribed from the output of the ‘analyze_components()’ function. It should be the same as the pixel count, but the pixel count is slightly less, which is because some of the objects have ‘holes’ … my Count does not include the ‘holes’.
The Reg, Green, and Blue columns are obviously the mean colour of each collagen bundle object.

One can process the dataframe values… eg compute means

julia> mean(bundledf.Red)
0.8303232147032467

julia> mean(bundledf.Count)
1354.6313131313132

So that is almost the end… I have a result for one image. I have a number of these images. I now need to set up a loop to process collections of images, and an extended DataFrame to hold multiple results. I need to save the DataFrame to a file. Maybe I will do the looping over images in a script that calls Julia for the processing step??

So how did this go as an exercise with Julia? Quite good… I found a way to work, I learnt what to leave well alone, I am not frightened of the REPL any more… for me it is just the way of accessing the compiler.
I can handle environments and packages, but modules have me beaten.
Writing code is no worse than in C or R. Finding functions and packages containing functions seems best done with Google. The Julia documentatiion is spread over Github sites and requires a search. One could hardly use Julia without the internet… that probably applies to Python and R too… older smaller languages like C will work standalone.

Would I use Julia again? Yes. It is more secure than Python, but not as secure as R or C. By secure , I mean not subject to malicious downloads of packages… not the nature of the language itself.

I have only scratched the surface of Julia.

I added 2 lines to save the bundledf as a file

using DataFrames
bundledf  = objmeanrgb(imglab,imgmeas,img)
using CSV
CSV.write("bundledf.csv",bundledf)

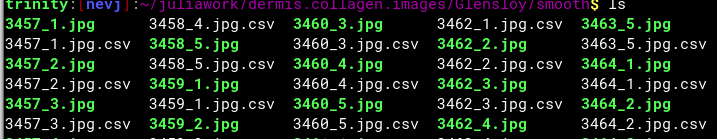
Then it writes a file

trinity:[nevj]:~/juliawork$ more bundledf.csv
Area,Red,Green,Blue,Count
238.0,0.8241251035581661,0.20830644811759016,0.21201291215067675,237
55.625,0.834509813785553,0.23508021912791513,0.2816399357535622,55
10050.375,0.8235816000139012,0.22127989021481342,0.2035818300737279,9996
.....

That works, regardless of whether I run the program in REPL, or run it as a script

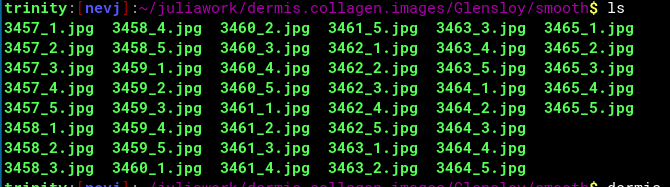
trinity:[nevj]:~/juliawork$ julia collagen.jl
  Activating project at `~/juliawork/imagenv`
WARNING: using ImageComponentAnalysis.label_components in module Main conflicts with an existing identifier.

I always get that warning… it is a name clash… Julia is riddled with NameSpace issues and Type issues.

Now I need to make that script work on any image. That involves passing command line arguments into the program… another challenge!

3 Likes

I wondered how you would write out the dataframe. You could use other formats and maybe save space if that’s an issue. Saving to CSV makes it pretty portable and generic, so that should work.

1 Like

Yes, the REPL does not save either code or objects… same if I run it as a script… it has to write output just like any program. R is different, it saves every object in the workspace… you accumulate a lot of junk in R.

2 Likes

Now I need to make that script work on any image. That involves passing command line arguments into the program… another challenge!

I modified my .jl script as follows

  • comment out all the image display
  • use a command line argument as the image filename
  • use the same filename to label the .csv output file

Now it looks like this

using Pkg
Pkg.activate("imagenv")
include("imgfuncs.jl")

using Images, FileIO, ImageView, ImageIO, Gtk4, Plots

filename = ARGS[1]
img = load(filename)

s = recommend_size(img)
imgb = binarize(AdaptiveThreshold(percentage = 15, window_size = s), img)

imgbrev = Int.(imgb) .== 0

imgbreverode = erode(imgbrev,strel_box((5,5))

imglab = label_components(imgbreverode)

using ImageComponentAnalysis
imgmeas = analyze_components(imglab,BasicMeasurement(area=true))

using DataFrames
bundledf  = objmeanrgb(imglab,imgmeas,img)
using CSV
outfilename = string(filename , ".csv")
CSV.write(outfilename,bundledf)

I removed all the comented out image display code… that was for debugging

Now I can run it as a julia script

julia collagen1img.jl 3506s.jpg

and it runs silently and makes an output file

trinity:[nevj]:~/juliawork$ more 3506s.jpg.csv
Area,Red,Green,Blue,Count
238.0,0.8241251035581661,0.20830644811759016,0.21201291215067675,237
55.625,0.834509813785553,0.23508021912791513,0.2816399357535622,55
10050.375,0.8235816000139012,0.22127989021481342,0.2035818300737279,9996
4.125,0.7882353067398071,0.3117647171020508,0.3656862825155258,4
......  
396 lines

So now I have the basis for processing multiple image files
First I need to standardize the filenames…I have lots of images… 5 microscope fields per sheep and several sheep representing flocks with either wrinkled or smooth skin.
I have to set the labelling up for an analysis which I hope will show that wrinkled sheep have a different type of collagen than smooth sheep.

3 Likes

I have been following this master lesson on how to learn a new language and thinking that’s how pros do it!. Thank you !

But regarding julia, it seems like in REPL mode it is an ideal flexible programmable calculator app or even to tweak interactively scritpts.
But to run a program, it appears rather inflexible and almost a second priority. Since many libraries are compatible with say C++ etc, then not obvious to how the bias for scientific apps is much better better. Am I missing something?

1 Like

Hi @RG1 ,
I think your observation is correct.
REPL seems to be useful while I am writing and debugging code
but
when I have a working program, it runs easier as a script

The REPL in R ( called a workspace) is entirely different… it saves every code and data object you create , and I can create multiple R workspaces in different directories, and they do not clash. I prefer the R approach, because I am used to it , I suppose.

The Julia REPL annoyed me at first. It saves nothing. Now I just use it for debugging.
Maybe that is what is intended.?
Julia is the most complicated programming environment I have experienced. Too many features… modules, files, environments, packages.

I think what might be better in Julia is the ability to do parallel programming… ie use multiple threads for long calculations. That is what I am working towards… I have some R code that is slow… I may be able to speed it up by rewriting some functions in Julia.
As you say, the libraries are much the same as for R or C

Thank you for responding. There are not many in this forum who are interested in programming. Not sure I am any sort of expert at learning languages… i tend to find a project and start writing code… learn from the mistakes. Today with the internet you can just about answer any coding question by googling. Years ago all you had was the manual and maybe a help desk.

Regards
Neville

2 Likes

Thank you @nevj for your response. Julia in REPL mode seems a great idea, but without a fully integrated project(?) mode feels more like work in progress. Promissing, but sadly not for me.

Thanks again, RG

1 Like

See my topic

I have a directory structure for images as follows

dermis.collagen.images
├── Glensloy
│   ├── smooth
│   └── wrinkled
│       ├── between
│       └── on
└── Manton
    ├── smooth
    └── wrinkled
        ├── between
        └──on

2 farms called Glensloy and Manton, groups of smooth-skin and wrinkled-skin sheep, and within the wrinkled group samples taken either on a wrinkle or between wrinkles.
In each lower level directory there is a set of image files like this

The numbers like 3457 refer to individual sheep, and there are 5 microscope fields per sheep denoted by _1 to _5

I now make a small shell script

#!/bin/sh
for i in dermis.collagen.images/Glensloy/smooth/*
  do
    julia  ./collagen1img.jl $i
  done

which will process all the images in a directory, and the program collagen1img.jl ( see previous reply for listing) will write its output in .csv files like 3457_1.jpg.csv

It takes quite a while (like about 45 mins) to process the 45 images in one subdirectory
I end up with this

there is more…
One .csv file for every sheep and every microscope field.

Now I have to repeat that for each of the six subdirectories of images… experience has taught me to do things in manageable lumps.

I probably could have made the loop over images in Julia , instead of using a script. That may have been more efficient.

Next step: Combine all of these .CSV files into a dataframe, with appropriate codings for farm, smooth vs wrinkles, on vs between wrinkles, sheep number and microscope field number.
Then it would be ready for analysis.
I will try and do this dataframe and analysis work in Julia, but I may have to fall back to R.

Best workplan for this sort of task is to break it down into small steps… ‘divide and conquer’ works for programming and for data processing.

3 Likes

That may be my conclusion too. I will give it a bit more time yet.
You should try R… it has what you call “project mode”… you simply put each project in its own directory.
You can even run multiple projects simultaneously, each with its own copy of R running, All kept separate.

Cheers
Neville

1 Like

One thing which I discovered while running this script :slight_smile:
The program collagen1img.jl has to be executed in the directory in which it was developed … in my case that was ~/juliawork.
That seems to be because the enviroment of collagen1img.jl resides here

trinity:[nevj]:~/juliawork$ tree imagenv
imagenv
├── Manifest.toml
└── Project.toml
1 directory, 2 files

in those .toml files,
and it cant find them if I try to run collagen1img.jl in any other directory.
Hence I could not run the script in the directory where the image files resided, it had to be run in ~/juliawork and the image files had to have a path.

That seems to me more than slightly inconvenient. One can not make a general purpose program that will run anywhere… it is tied to the Julia structure setup during development.
I guess that is what you get with a jit compiler. The R interpreter is not like that…I can move an R function anywhere andit still runs. Compilers are not like that… a compiled program is independent of everything, except dynamically linked object files, and the OS provides those.

Maybe there is a way of moving environments in Julia around the filesystem, but I have not discovered it yet

Environments are discussed here

but there is nothing on making them portable.?

I think environments are what @RG1 is seeking.
They seem at the moment ( to me) to be rather unmanageable.
I read advice that said ‘work in an environment’ so I set one up, and now it is constraining me.

3 Likes

I need to add some labelling information to my saved.csv files.
So I wrote a Julia script to label all the.csv files in one directory

trinity:[nevj]:~/juliawork$ cat csvlabel.jl
using Pkg
using DataFrames,CSV
#using ArgParse

farm = "Glensloy"
grade = "smooth"
for arg in ARGS
 df = CSV.read(arg,delim= ",",DataFrame)
 sheep = arg[1:4]
 field = arg[6]
 df.Farm .= farm
 df.Grade .= grade
 df.Sheep .= sheep 
 df.Field .= field
 df = select(df,[:Farm, :Grade, :Sheep, :Field, :Area, :Red, :Green, :Blue, :Count])
# cols = [:Farm, :Grade, :Sheep, :Field];
# df = select)df, cols, Not(cols))
 outfilename = string("lab",arg)
 CSV.write(outfilename,df)
end

That is for the dermis.collagen.images/Glensloy/smooth directory.
I tested it on a single .csv file

trinity:[nevj]:~/juliawork$ julia csvpool.jl 3506_1.jpg.csv
trinity:[nevj]:~/juliawork$ ls *.csv
3506_1.jpg.csv  3506s.jpg.csv  bundledf.csv  lab3506_1.jpg.csv

so it made a file lab3506_1.jpg.csv.
It looks like this

trinity:[nevj]:~/juliawork$ more lab3506_1.jpg.csv
Farm,Grade,Sheep,Field,Area,Red,Green,Blue,Count
Glensloy,smooth,3506,1,238.0,0.8241251035581661,0.20830644811759016,0.2120129121
5067675,237
Glensloy,smooth,3506,1,55.625,0.834509813785553,0.23508021912791513,0.2816399357
535622,55

So the labels are the first 4 fields.

This .csv file reads into R quite nicely

R

> df = read.table("lab3506_1.jpg.csv",header=T,sep=',')
> df[1:3,]
      Farm  Grade Sheep Field      Area       Red     Green      Blue Count
1 Glensloy smooth  3506     1   238.000 0.8241251 0.2083064 0.2120129   237
2 Glensloy smooth  3506     1    55.625 0.8345098 0.2350802 0.2816399    55
3 Glensloy smooth  3506     1 10050.375 0.8235816 0.2212799 0.2035818  9996
> q()

A few notes on the script

  • a DataFrame is a table where each column can be a different type of variable.
  • you can reference a column within a DataFrame with, for example df.Sheep
  • you can reorder the columns of a DataFrame with select()
  • the command line arguments when you run a julia script ( eg julia script.jl arg1 arg2) are stored in ARG
  • the for arg in ARGS loop selects one argument at a time. My script is intended to process all files in a directory by julia script.jl *
  • my script is for one directory only… keep it simple. I need to change farm and grade each time I run it.

The R test was just a good way to see if the output was correct. R has DataFrames too. I must learn how to do that in theJulia REPL.

Update.
It is easy in the Julia REPL to read in and look at a DataFrame

trinity:[nevj]:~/juliawork$ julia
julia> using DataFrames,CSV

julia> df = CSV.read("lab3506_1.jpg.csv",delim= ",",DataFrame)
396×9 DataFrame
 Row │ Farm      Grade    Sheep  Field  Area       Red       Green     Blue       Count 
     │ String15  String7  Int64  Int64  Float64    Float64   Float64   Float64    Int64 
─────┼──────────────────────────────────────────────────────────────────────────────────
   1 │ Glensloy  smooth    3506      1    238.0    0.824125  0.208306  0.212013     237
   2 │ Glensloy  smooth    3506      1     55.625  0.83451   0.23508   0.28164       55
   3 │ Glensloy  smooth    3506      1  10050.4    0.823582  0.22128   0.203582    9996
   4 │ Glensloy  smooth    3506      1      4.125  0.788235  0.311765  0.365686       4
   5 │ Glensloy  smooth    3506      1   2800.62   0.813379  0.204517  0.189252    2792
   6 │ Glensloy  smooth    3506      1      8.125  0.848529  0.385294  0.423039       8
   7 │ Glensloy  smooth    3506      1    566.125  0.829961  0.29072   0.29042      561
   8 │ Glensloy  smooth    3506      1   7071.0    0.808323  0.215711  0.205289    7049
   9 │ Glensloy  smooth    3506      1   1455.38   0.775666  0.121109  0.118668    1452
  10 │ Glensloy  smooth    3506      1      1.0    0.780392  0.270588  0.309804       1
  11 │ Glensloy  smooth    3506      1    582.625  0.839045  0.278138  0.250543     574
  12 │ Glensloy  smooth    3506      1    910.5    0.836408  0.261074  0.258828     901
  13 │ Glensloy  smooth    3506      1    795.625  0.836472  0.270384  0.261299     789
  14 │ Glensloy  smooth    3506      1   8288.88   0.808994  0.179979  0.172811    8250
  ⋮  │    ⋮         ⋮       ⋮      ⋮        ⋮         ⋮         ⋮          ⋮        ⋮
 383 │ Glensloy  smooth    3506      1      1.0    0.87451   0.317647  0.301961       1
 384 │ Glensloy  smooth    3506      1      2.0    0.866667  0.333333  0.305882       2
 385 │ Glensloy  smooth    3506      1   1172.62   0.827437  0.246778  0.220094    1161
 386 │ Glensloy  smooth    3506      1    242.75   0.811023  0.224287  0.199967     238
 387 │ Glensloy  smooth    3506      1      8.0    0.678922  0.1       0.0759804      8
 388 │ Glensloy  smooth    3506      1    335.625  0.823541  0.241573  0.226859     331
 389 │ Glensloy  smooth    3506      1   2117.0    0.803853  0.190015  0.169664    2107
 390 │ Glensloy  smooth    3506      1     53.625  0.829967  0.278357  0.280133      53
 391 │ Glensloy  smooth    3506      1      1.0    0.815686  0.266667  0.262745       1
 392 │ Glensloy  smooth    3506      1    198.125  0.819548  0.246239  0.232813     196
 393 │ Glensloy  smooth    3506      1   2252.0    0.794751  0.14981   0.163935    2239
 394 │ Glensloy  smooth    3506      1     11.375  0.849554  0.266667  0.276649      11
 395 │ Glensloy  smooth    3506      1     41.625  0.812243  0.184122  0.195791      41
 396 │ Glensloy  smooth    3506      1      4.0    0.838235  0.302941  0.333333       4
                                                                        368 rows omitted

julia> 

The REPL automatically prints the result of every command, unless you end the line with ‘;’
It only prints the first 14 and last 14 rows of a large DataFrame.
In R you use subscripts to limit output.
I quite like the Julia format.. the horizontal and vertical lines help

3 Likes